From 0 to 30k: a theoretical journey through Star Citizen's network architecture
Table of Contents
“In space, no one can hear you lag” - unless you’re in proximity chat, then everyone hears you rubber-band.
Star Citizen’s networking architecture is as vast and complex as the verse itself. From managing thousands of players across multiple star systems to synchronizing physics grids within physics grids, the technical challenges are astronomical.
When CIG says “networking is hard” and “server meshing is complex”, they’re not kidding - this article will show you exactly why, diving into the theoretical foundations of what it takes to keep thousands of players connected in a seamless universe.
The idea for this article came after watching the latest ISC, which somehow led to me flooding my org’s Discord with rambles about exponential distributions and network statistics. Because apparently that’s what I do for fun now - analyzing network architectures of a game that has already consumed more of my wallet than I’m willing to admit publicly.
Core network concepts #
Before we quantum travel into the deep analysis, let’s understand some key concepts that affect your journey through the verse. Just like you wouldn’t jump into Pyro without understanding your quantum drive, we shouldn’t dive into network analysis without understanding the basics.
RTT (Round Trip Time): the Space Mail Service #
Round Trip Time is exactly what it says on the tin - the time it takes for a signal to make a round trip:
- Your client sends a packet to the server (like sending a distress signal)
- The server processes it (like Crusader Security reading your signal)
- The server sends a response (like Security saying “we’ll be right there!”)
- Your client receives the response (and you realize they’re not coming)
When players say “my ping is 50ms”, they’re actually talking about RTT. It’s like measuring how long it takes to yell “Carrack is life!” and hear the echo. Example RTT measurements:
Local network: 1-5ms (like talking to someone in the same room)
Same region: 20-50ms (like calling someone in the same star system)
Cross-region: 100-200ms (like communicating across systems)
Mars colony: 3-22 minutes (okay, we're not there yet)
Jitter: the quantum drive stability #
If RTT is like your quantum travel time, jitter is how smoothly you get there. It measures the variation in RTT, not the RTT itself.
- Low jitter (smooth quantum travel):
Ping 1: 50ms (Like a perfectly calibrated Luxury quantum drive)
Ping 2: 52ms
Ping 3: 49ms
Standard deviation: ~1.5ms
- High jitter (feels like a Drake ship):
Ping 1: 50ms (Like a salvaged quantum drive)
Ping 2: 120ms (Hit some debris)
Ping 3: 45ms (Emergency quantum recalibration)
Standard deviation: ~42ms
In networking terms, jitter is often measured as the Packet Delay Variation (PDV), which is a fancy way of saying “how inconsistent is my connection?”
Percentiles: understanding network performance distribution #
Percentiles help us understand our network performance distribution better than averages. Think of it like ship component ratings, but for network performance. Imagine lining up 100 network measurements from fastest to slowest:
P50 (Median): the middle value - your typical experience
- If P50 = 100ms, half your packets are faster
- Like your average quantum travel time
P95: only 5 measurements were slower
- Critical for understanding “bad” moments
- Like your worst cargo runs
P99: only 1 measurement was slower
- Represents your worst-case scenarios
- Like those times you try to land at Orison
Why do we care about percentiles? Because averages lie more than a Hurston security guard. Look at these two scenarios:
- Scenario A (Consistent)
RTTs: [100, 101, 102, 103, 104]
Average: 102ms
P99: 104ms
Experience: Smooth gameplay
- Scenario B (Spiky):
RTTs: [100, 100, 100, 100, 500]
Average: 180ms
P99: 500ms
Experience: That one time you rubber-banded into an asteroid
Packet loss: the quantum drive mishaps #
Sometimes packets, like cargo during emergency quantum breaks, just get lost. Packet loss is measured as a percentage of packets that never reach their destination.
- Good connection: 0-1% loss (Like a safe route through Stanton)
- Poor connection: 5%+ loss (Like navigating through Pyro)
- Critical: 15%+ loss (Like quantum traveling through an asteroid field)
Bandwidth: your quantum fuel capacity #
If latency is like quantum travel time, bandwidth is like your quantum fuel tank size - it determines how much data you can transfer at once. Required bandwidth varies by activity:
- Basic flight: ~100KB/s (Like cruising in atmosphere)
- Combat: ~300KB/s (Like dogfighting)
- Major battle: ~1MB/s+ (Like participating in Xenothreat)
The Analysis: diving deeper than a Pisces in atmosphere #
After years of troubleshooting networking issues and developing what I can only describe as a peculiar fascination1 with network-related problems, Star Citizen’s networking challenges have captured my attention. To understand these challenges, I’ve created a series of Python notebooks that model different aspects of the game’s networking architecture.
Technical Notes #
All analyses were performed using Python with numpy, pandas, and seaborn. For those interested in the technical details, the notebooks are available on colab:
I encourage readers to explore them for a deeper understanding of the network dynamics2.
As a network enthusiast rather than a mathematician or data scientist, I might have taken some liberties with statistical methods and data visualization techniques. The goal was to illustrate concepts rather than provide rigorous mathematical proofs: just remember - like CIG’s release dates, all numbers are subject to change.
Physics grid analysis: the russian doll of networking #
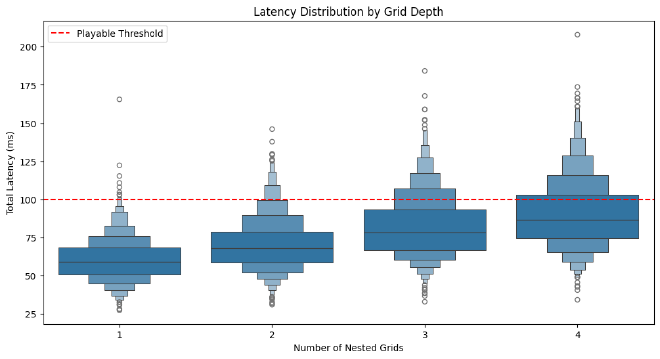
Our first analysis looks at how nested physics grids affect network synchronization. Think of a player in a Pisces (grid 1), inside a Carrack (grid 2), quantum traveling through space (grid 3) - that’s three physics grids that need to communicate their state across the network with different RTT requirements.
# Network impact of nested grids
grid_overheads = [np.random.exponential(10) for _ in range(depth)]
individual_grid_costs = grid_overheads
cumulative_cost = sum(grid_overheads)
total_latency = base_rtt + cumulative_cost
This simplified model illustrates why complex nested scenarios affect network performance:
- Each grid adds its own packet overhead
- Update frequencies multiply bandwidth needs
- Jitter compounds across grid levels
- Packet loss affects multiple grid layers
Network-critical situations include:
- P95 latency spikes during multi-grid transitions
- Bandwidth peaks when all grids update simultaneously
- Increased packet loss impact across nested grids
- RTT requirements becoming stricter with depth
And if you thought nested physics grids were complex, wait until we try to share them across servers…
Server meshing #
Remember how your parents told you to share your toys? Server meshing is like that, but with network packets trying to find their way through multiple servers without getting lost or arriving too late.
Our analysis focuses on the network challenges that emerge when data needs to traverse multiple server boundaries. Let’s break down the key network components:
def mesh_network_cost(source_server, target_server, entity_count):
    base_rtt = measure_RTT(source_server, target_server)  # Base network latency
    server_hops = get_server_hops(source_server, target_server)  # Path length

    # Network cost increases with hops and entity count
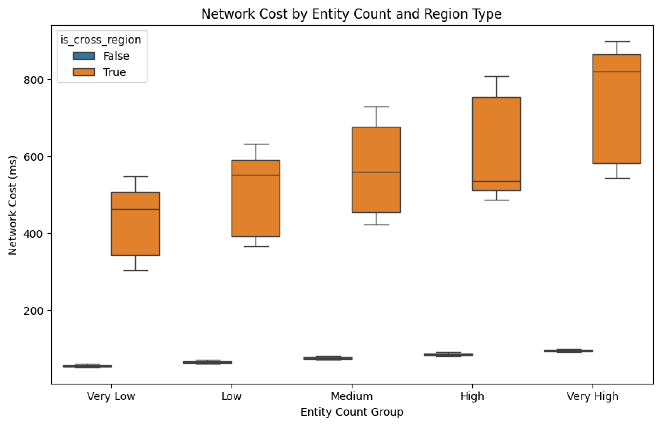
    total_cost = (base_rtt * server_hops) * (1 + (entity_count / 1000))

    return total_cost
Our simulation reveals three critical network patterns:
- Server hop impact: Each additional server in the path multiplies base RTT
- Entity count influence: More entities mean more network overhead
- Regional differences: Cross-region transitions show significantly higher costs
The visualizations from our analysis show how different combinations of these factors affect total network latency. Particularly interesting is how the network cost scales non-linearly when combining multiple hops with high entity counts.
Consider this when planning your next fleet operation - your Javelin might look amazing, but its network signature could be as massive as its radar cross-section!
Combat analysis: when milliseconds mean melted ships #
Our combat scenario analysis breaks down why some fights feel smoother than others. Let’s model how network conditions affect different combat scenarios:
def combat_viability(attacker, target, weapon_type):
    base_rtt = measure_RTT(attacker, target)
    connection_jitter = measure_jitter(attacker, target)
    packet_loss = get_packet_loss_rate()

    effective_delay = base_rtt + (connection_jitter * P95_FACTOR)
    packets_per_second = WEAPON_CONFIGS[weapon_type]['packets_per_second']

    bandwidth_needed = (packets_per_second *
        get_state_packet_size() *
        (1 + packet_loss))

    max_viable_latency = WEAPON_CONFIGS[weapon_type]['max_viable_latency']
    viability = max(0, 1 - (effective_delay / max_viable_latency))

    return {
        'viability': viability,
        'effective_delay': effective_delay,
        'bandwidth_required': bandwidth_needed,
        'p95_latency': base_rtt + (connection_jitter * P95_FACTOR),
        'p99_latency': base_rtt + (connection_jitter * P99_FACTOR)
    }
This models why different combat scenarios have different network tolerances:
FPS Combat (<100ms)
- Highest packet frequency needs
- Most sensitive to jitter
- P95 latency critical
- Minimal packet loss tolerance
Ship Combat (<200ms)
- Medium packet frequency
- More tolerant of jitter
- P95 latency important
- Some packet loss acceptable
Capital Ship Combat (<300ms)
- Lower packet frequency
- Jitter tolerant
- P99 latency sufficient
- Higher packet loss tolerance
Each scenario’s network requirements scale with:
- Distance between combatants (affects base RTT)
- Number of entities involved (affects bandwidth)
- Movement prediction needs (affects packet frequency)
- Damage calculation timing (affects latency tolerance)
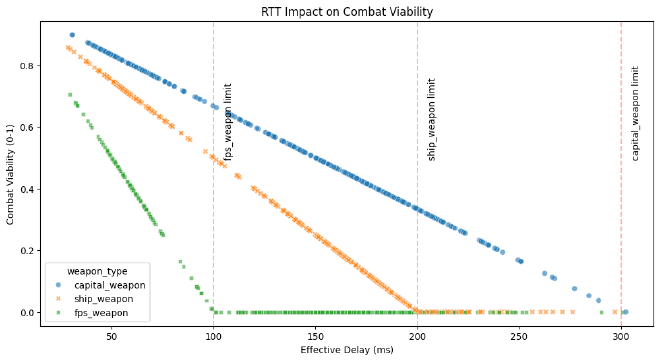
This helps explain why that sniper shot missed even though your crosshair was perfectly aligned - your P95 latency spike meant the target wasn’t quite where you saw them!
Important limitations of our analysis #
Our analysis focused solely on network conditions and their impact. In reality, server-side processing adds significant complexity, in fact we didnt’t model:
Server Processing Time
- Physics calculations for thousands of entities
- AI processing (NPCs, missions, economy)
- Dynamic event management
- Collision detection
- Environmental simulation (atmosphere, gravity)
Server Load
- CPU utilization impact
- Memory constraints
- Database operations
- Resource contention
- Player count impact on processing
Real World Example #
Consider a simple ship weapon fire. Let’s model both our simplified network-only version and a more realistic scenario that includes server constraints:
# Simplified Model (just network)
simplified_latency = base_rtt

# Realistic Model (network + server)
realistic_latency = (
    base_rtt/2 +                              # Client → Server
    np.random.uniform(0, 33) +                # Wait for server tick (30Hz)
    33 +                                      # Server processing
    base_rtt/2                                # Server → Client
)
Let’s simulate some typical scenarios:
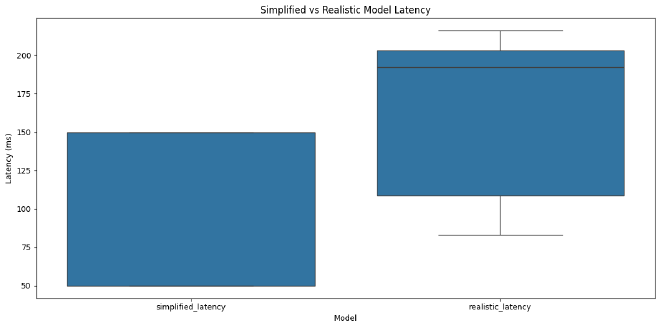
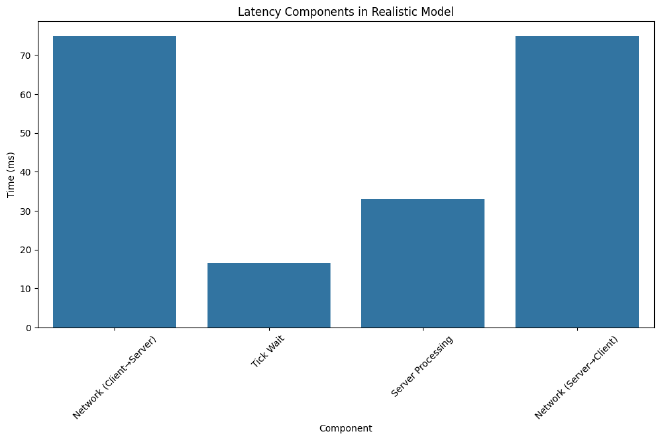
This helps explain why:
- Combat feels different at different times of day (server load)
- Leading targets requires different adjustments based on conditions
- The same weapon can feel different on different servers
Remember: these are still simplified models - real implementations have additional complexity like:
- Prediction systems
- Lag compensation
- Hit validation
- Damage calculation queues
Beyond the models #
Our analysis barely scratches the surface of what makes MMO networking truly challenging. Think about these dimensions:
Scale vs detail #
Most MMOs choose their battles: EVE Online handles thousands of players by simplifying physics and combat mechanics, while FPS games maintain precise hit detection by limiting player counts. Star Citizen attempts both - precise physics and hit detection at a massive scale. Each additional layer of detail multiplies networking complexity:
- Precise physics requires constant synchronization
- Detailed damage models mean more states to track
- Multiple simulation layers need to stay in sync
- Everything must work on solar system distance scales
The uncertainty principle of gaming #
The more precise your simulation needs to be, the harder it becomes to maintain network consistency. It’s like Heisenberg’s uncertainty principle for gaming - you can have perfect accuracy or perfect responsiveness, but not both. Every game makes different tradeoffs:
- Counter-Strike prioritizes precise hit registration
- Minecraft favors responsiveness over precision
- Star Citizen needs both for its combined FPS/space simulation
The complexity domino #
Each feature added to an MMO doesn’t just add its own network requirements - it multiplies the complexity of existing systems:
- Adding medical gameplay affects combat scenarios
- Inventory systems interact with physics grids
- Weather affects ship components which affect physics
- Everything eventually needs to sync across servers
When you look at it this way, “networking is hard” becomes less of a statement and more of an understatement. Our simple models measure just a few dimensions of this challenge - the real implementation has to juggle all these aspects simultaneously while maintaining playable performance across global networks.
Conclusions #
Our analysis shows how even simplified models of Star Citizen’s networking reveal multiple layers of interconnected complexity. When a network has to handle everything from physics grids inception (grids within grids within grids) to server meshing that makes distributed systems professors nervous, you start to understand why “30k” is more than just a disconnection message - it’s a reminder that we’re pushing the boundaries of what’s possible in online gaming.
And here’s the kicker: if our simplified models - measuring just basic network metrics like RTT, jitter, and packet loss - already show this level of complexity,
imagine what it takes to manage these systems in a live service! We’re talking about real-time physics synchronization, dynamic server boundaries,
and combat calculations for thousands of players, all while dealing with unpredictable network conditions, varying server loads,and that one player who decided to fill their C2 with 1E+2 trolleys
(because apparently regular notation isn’t enough to express this level of physics grid abuse)
No packets were harmed in the making of this analysis, though several 30ks were encountered during research.